


2012 USDA Plant Hardiness Zone Map
c2g
12 years ago
Sort by:Oldest
Comments (40)
Related Stories
GARDENING GUIDESHow to Find the Right Plants for Your Garden
Break free from choosing plants by cold-hardiness zones for a beautiful landscape that thrives year-round
Full Story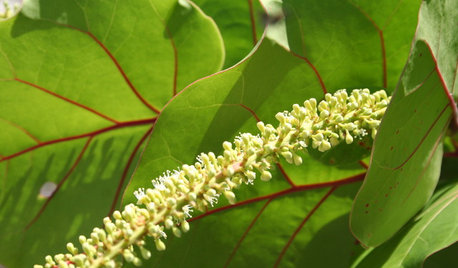
GARDENING GUIDESGreat Design Plant: Sea Grape, a Hardy Coastal Delight
Up to the high-tide line or even indoors, sea grape draws smiles for its looks and cheers for its tenacity
Full Story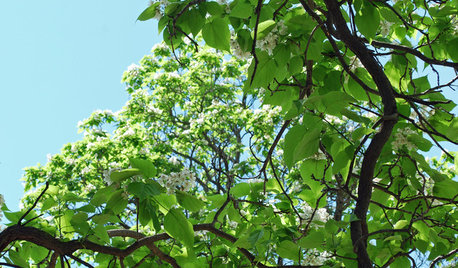
LANDSCAPE DESIGNGreat Design Plant: Retreat to the Shade of Hardy Catalpa
Big foliage and a towering height provide a shady respite in summer, but that's not all hardy catalpa offers dedicated gardeners
Full Story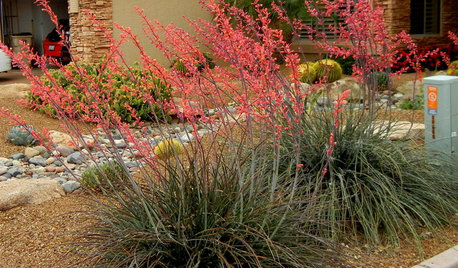
GARDENING GUIDES10 Cold-Hardy Succulents for Cool-Season Interest
These attractive plants shrug off colder temperatures, and many can be brought inside in containers in extra-chilly climates
Full Story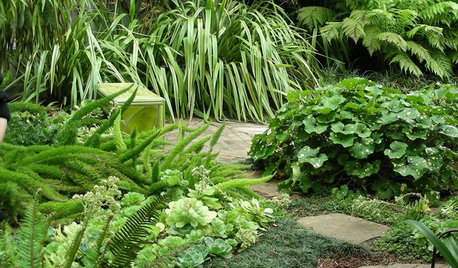
PLANTING IDEAS8 Sumptuous Shade Garden Plant Combinations
Enjoy these plant combinations made for spots with varying levels of shade and different garden zones
Full Story
TREES7 Deer-Resistant Flowering Trees to Plant this Fall
If you live in a neighborhood with roaming deer, consider these beautiful trees that won't tempt hungry guests
Full Story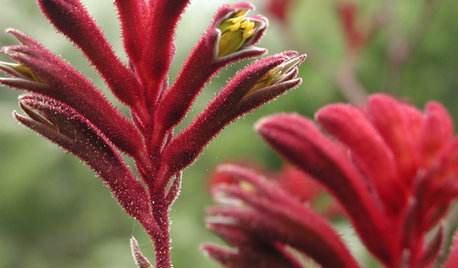
GARDENING GUIDESGreat Design Plant: Red Kangaroo Paw
Plant this dramatic perennial in fall or spring for its height, hardiness and beautiful red blooms
Full Story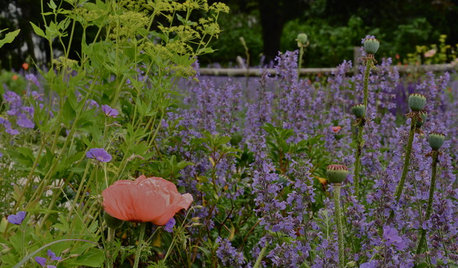
GARDENING GUIDESGreat Design Plant: Walker's Low Catmint
Prolific purple blooms, fragrant leaves, and cold-hardiness makes this a go-to plant for almost any garden
Full StoryRED FOLIAGEGreat Design Plant: New Zealand Flax
A commanding presence, year-round foliage and a hardy nature make flax a winner in the landscape even in fall and winter
Full Story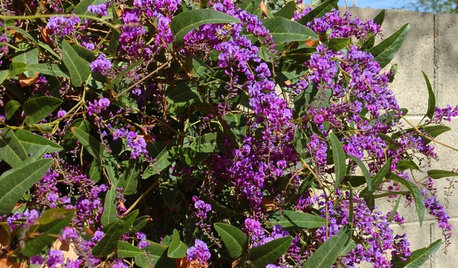
GARDENING GUIDESGreat Design Plant: Lilac Vine for a Purple Profusion in Winter
Grow this pretty, hardy vine on a fence or as a ground cover for blooms throughout the colder months
Full StoryMore Discussions


ken_adrian Adrian MI cold Z5
arktrees
Related Professionals
Willowick Landscape Architects & Landscape Designers · Wilmington Landscape Contractors · Firestone Landscape Contractors · Fort Worth Landscape Contractors · Hilo Landscape Contractors · Homewood Landscape Contractors · Oak Forest Landscape Contractors · Rockwall Landscape Contractors · Saint John Landscape Contractors · St. Louis Landscape Contractors · Batavia Decks, Patios & Outdoor Enclosures · Boston Decks, Patios & Outdoor Enclosures · Draper Decks, Patios & Outdoor Enclosures · Green Bay Decks, Patios & Outdoor Enclosures · Roanoke Decks, Patios & Outdoor Enclosuresj0nd03
whaas_5a
hortster
whaas_5a
wisconsitom
User
poaky1
Iris GW
brandon7 TN_zone7
alabamatreehugger 8b SW Alabama
salicaceae
brandon7 TN_zone7
brandon7 TN_zone7
arktrees
brandon7 TN_zone7
whaas_5a
brandon7 TN_zone7
noki
Toronado3800 Zone 6 St Louis
ken_adrian Adrian MI cold Z5
arktrees
whaas_5a
hogmanay
brandon7 TN_zone7
terrene
Embothrium
brandon7 TN_zone7
arktrees
snasxs
whaas_5a
lou_spicewood_tx
arktrees
brandon7 TN_zone7
brandon7 TN_zone7
hogmanay
famartin
hogmanay
Embothrium